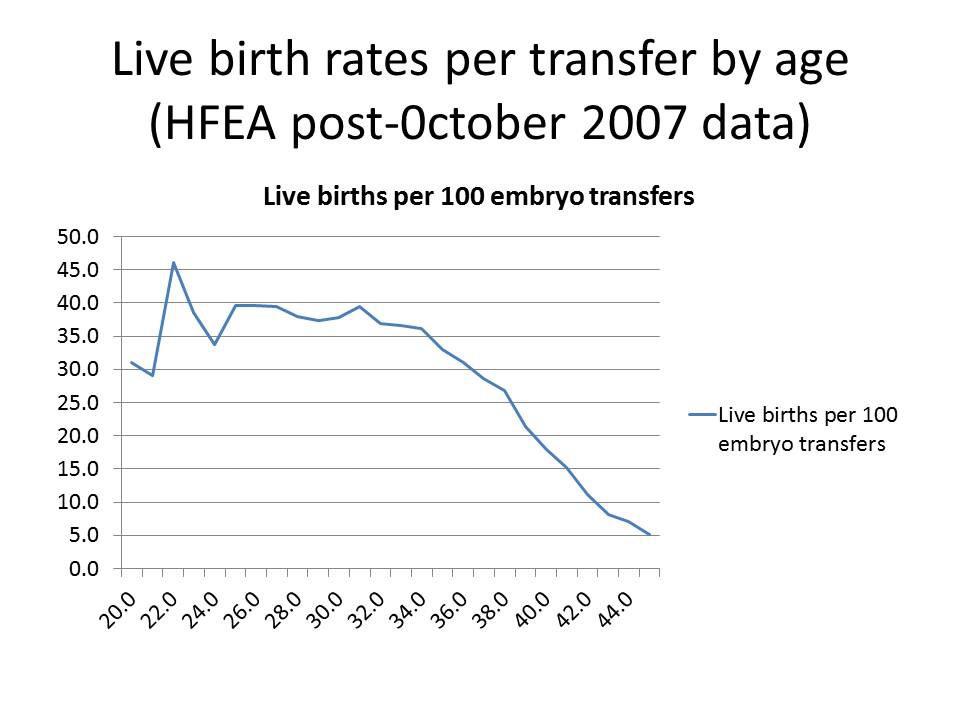
IVF success in terms of live births per 100 embryo transfers
In the graph below the vertical axis shows embryo transfers; the horizontal axis shows age of woman
- shows the live birth date per embryo transfer falls significantly after a woman is in her mid 30s
- based on all 52,996 embryo transfers using the woman's own eggs undertaken in the UK between 1 October 2007 and 30 June 2009) (note: small numbers of women aged under 24 years in the HFEA database)
Reference:
- NICE. Fertility problems: assessment and treatment. Clinical guideline CG156. Published February 2013, last updated September 2017
Related pages
Create an account to add page annotations
Annotations allow you to add information to this page that would be handy to have on hand during a consultation. E.g. a website or number. This information will always show when you visit this page.