This site is intended for healthcare professionals

Go to /sign-in page

You can view 5 more pages before signing in

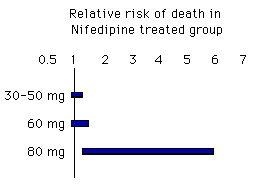
Graph of mortality with short-acting nifedipine
Authoring team

Bar graph depicting the relative risk of death in Nifedipine treated groups at dosages of 30-50 mg, 60 mg, and 80 mg, indicating an increasing risk with higher dosages.

Create an account to add page annotations

Add information to this page that would be handy to have on hand during a consultation, such as a web address or phone number. This information will always be displayed when you visit this page