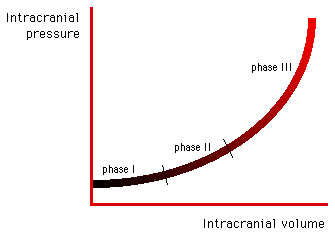
Diagram of the increase in ICP with increasing volume
Related pages
Create an account to add page annotations
Add information to this page that would be handy to have on hand during a consultation, such as a web address or phone number. This information will always be displayed when you visit this page