Right shift of the oxygen-haemoglobin dissociation curve
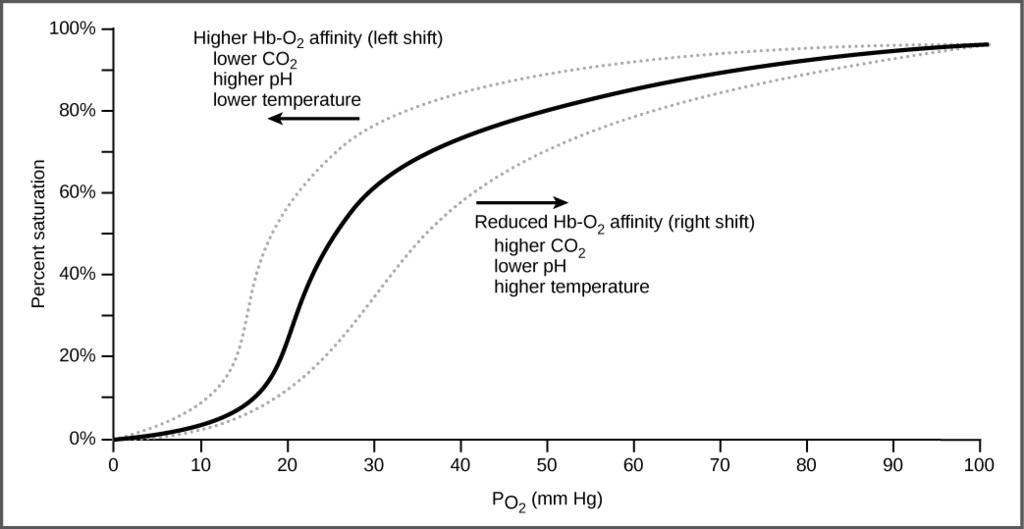
O2 is released in the tissues where the pO2 is low. In this situation Hb has a low affinity for oxygen. Other factors may cause a further reduction in Hb affinity for oxygen - ie a lower oxygen saturation for a given pO2.
Factors which result in shifting of the oxygen-dissociation curve to the right include increased concentration of pCO2, acidosis, raised temperature and high concentrations of 2,3 diphosphoglycerate (2,3 DPG). These factors, in effect, cause the Hb to give up oxygen more readily.
Related pages
Create an account to add page annotations
Add information to this page that would be handy to have on hand during a consultation, such as a web address or phone number. This information will always be displayed when you visit this page